Analytics that explain why, not just what.
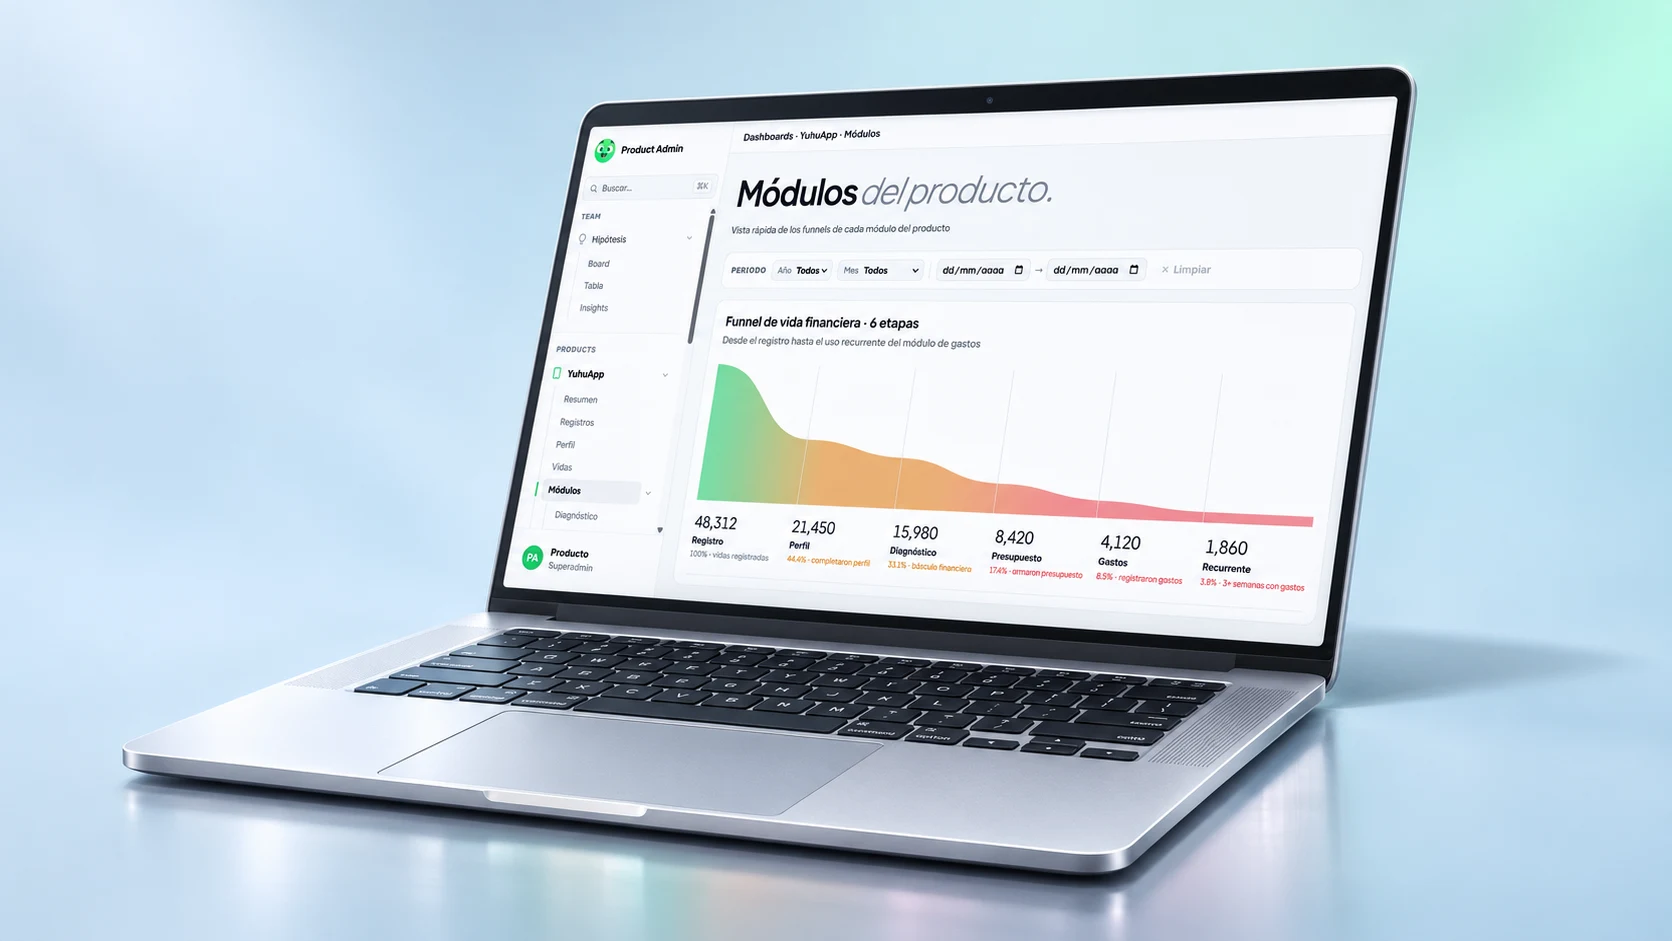
Every release I plan comes with the dashboards that will measure it. I build them with Claude Code inside Yuhu's internal Product Admin, so the whole team reads the product the same way.
- Role
- Designed & built the product analytics
- Built with
- Claude Code · GitHub
- Used by
- Product team, leaders, committee
- Cadence
- Daily · weekly · monthly
- The problem
- Numbers lived in different places, a number on its own said nothing, and the team's work had no visible result.
- What I did
- One console where every signal is compared against its usual range, events add context, and initiatives are tracked as measurable hypotheses.
- The outcome
- A shared weekly ritual: read the signals, log what happened, review hypotheses — with AI-written insights to start the conversation.
A number alone says nothing.
Before, every product question needed its own query, and there was no shared way to say whether something was good or bad. Three things needed fixing:
- Scattered numbers
Sign-ups, budgets, sales, and the chatbot lived in different places. Now they read with the same period and format.
- No reference point
Each signal is compared against its usual range — a normal week is easy to tell from one that needs attention.
- Work without visible results
Initiatives are logged as hypotheses and reviewed next to the metrics they should move.
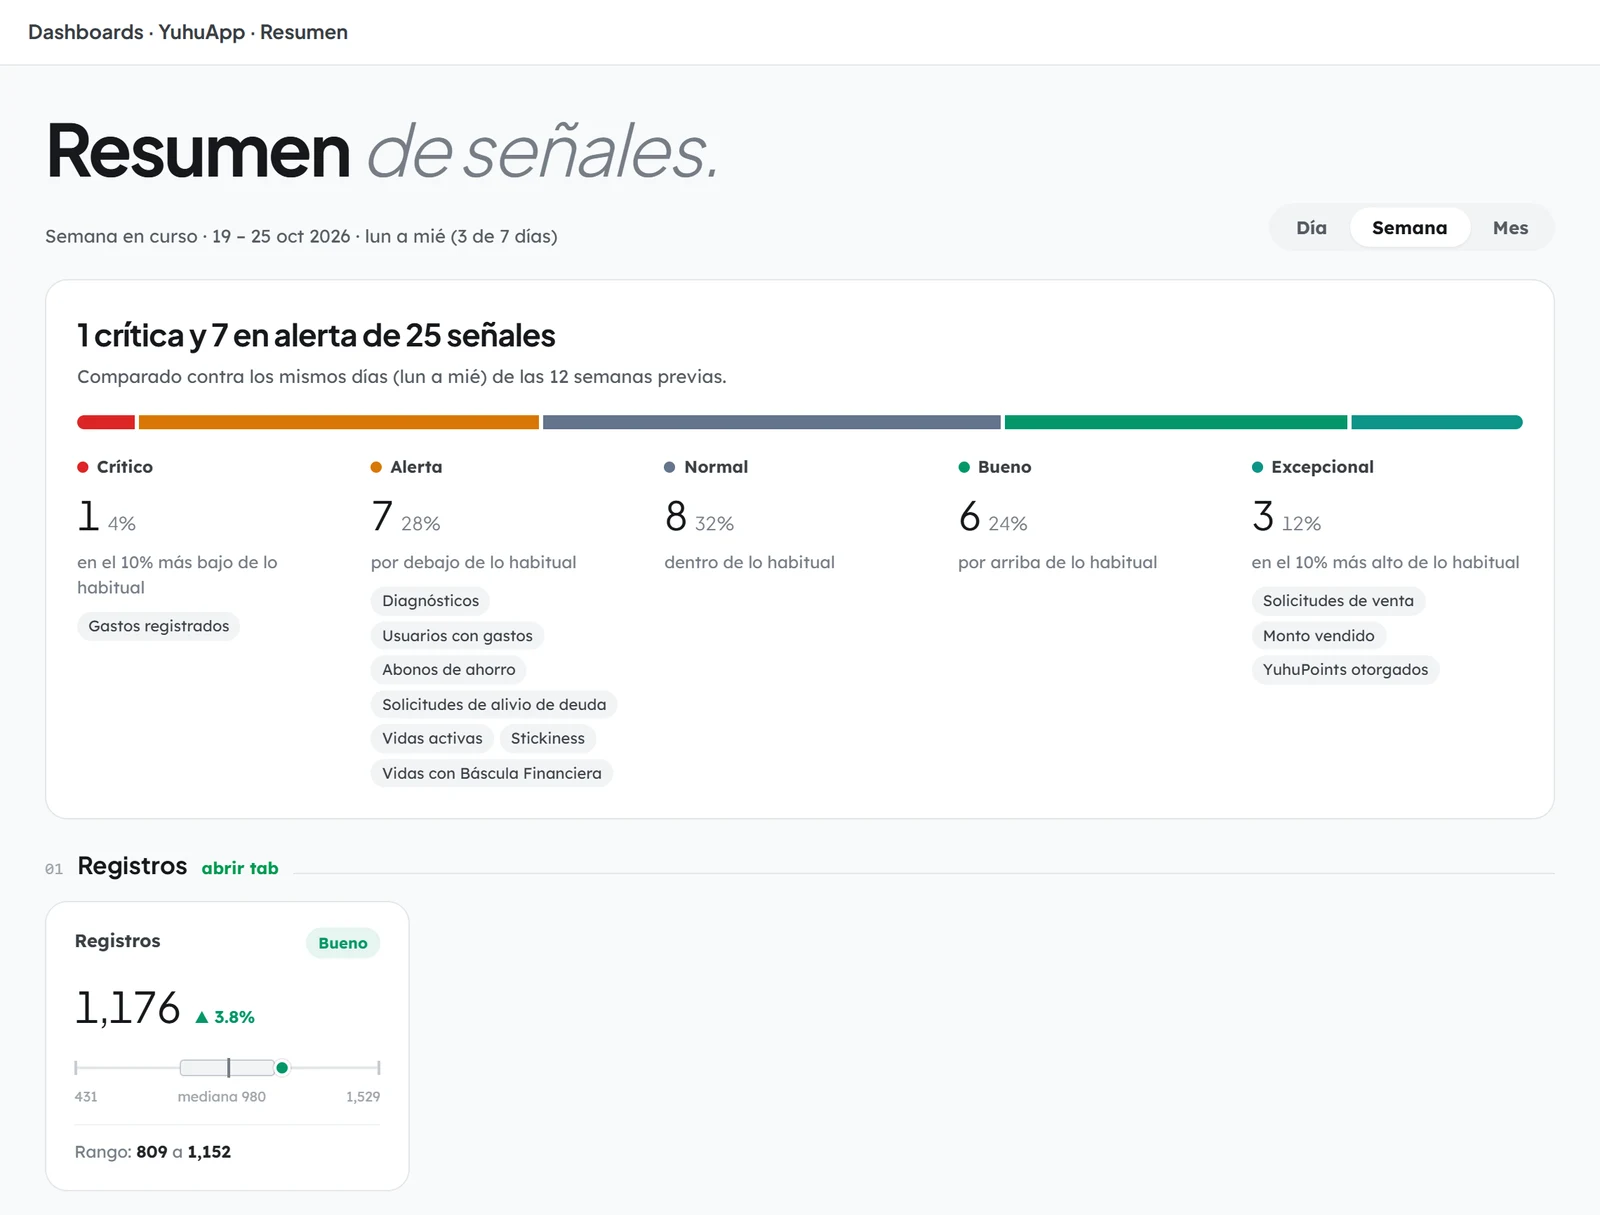
Compared against the usual.
Every signal sits inside its historical band — critical, alert, normal, good, or exceptional — based on where it falls compared with previous weeks. If the period is only half over, it’s compared against the same days of previous periods, not against full ones.
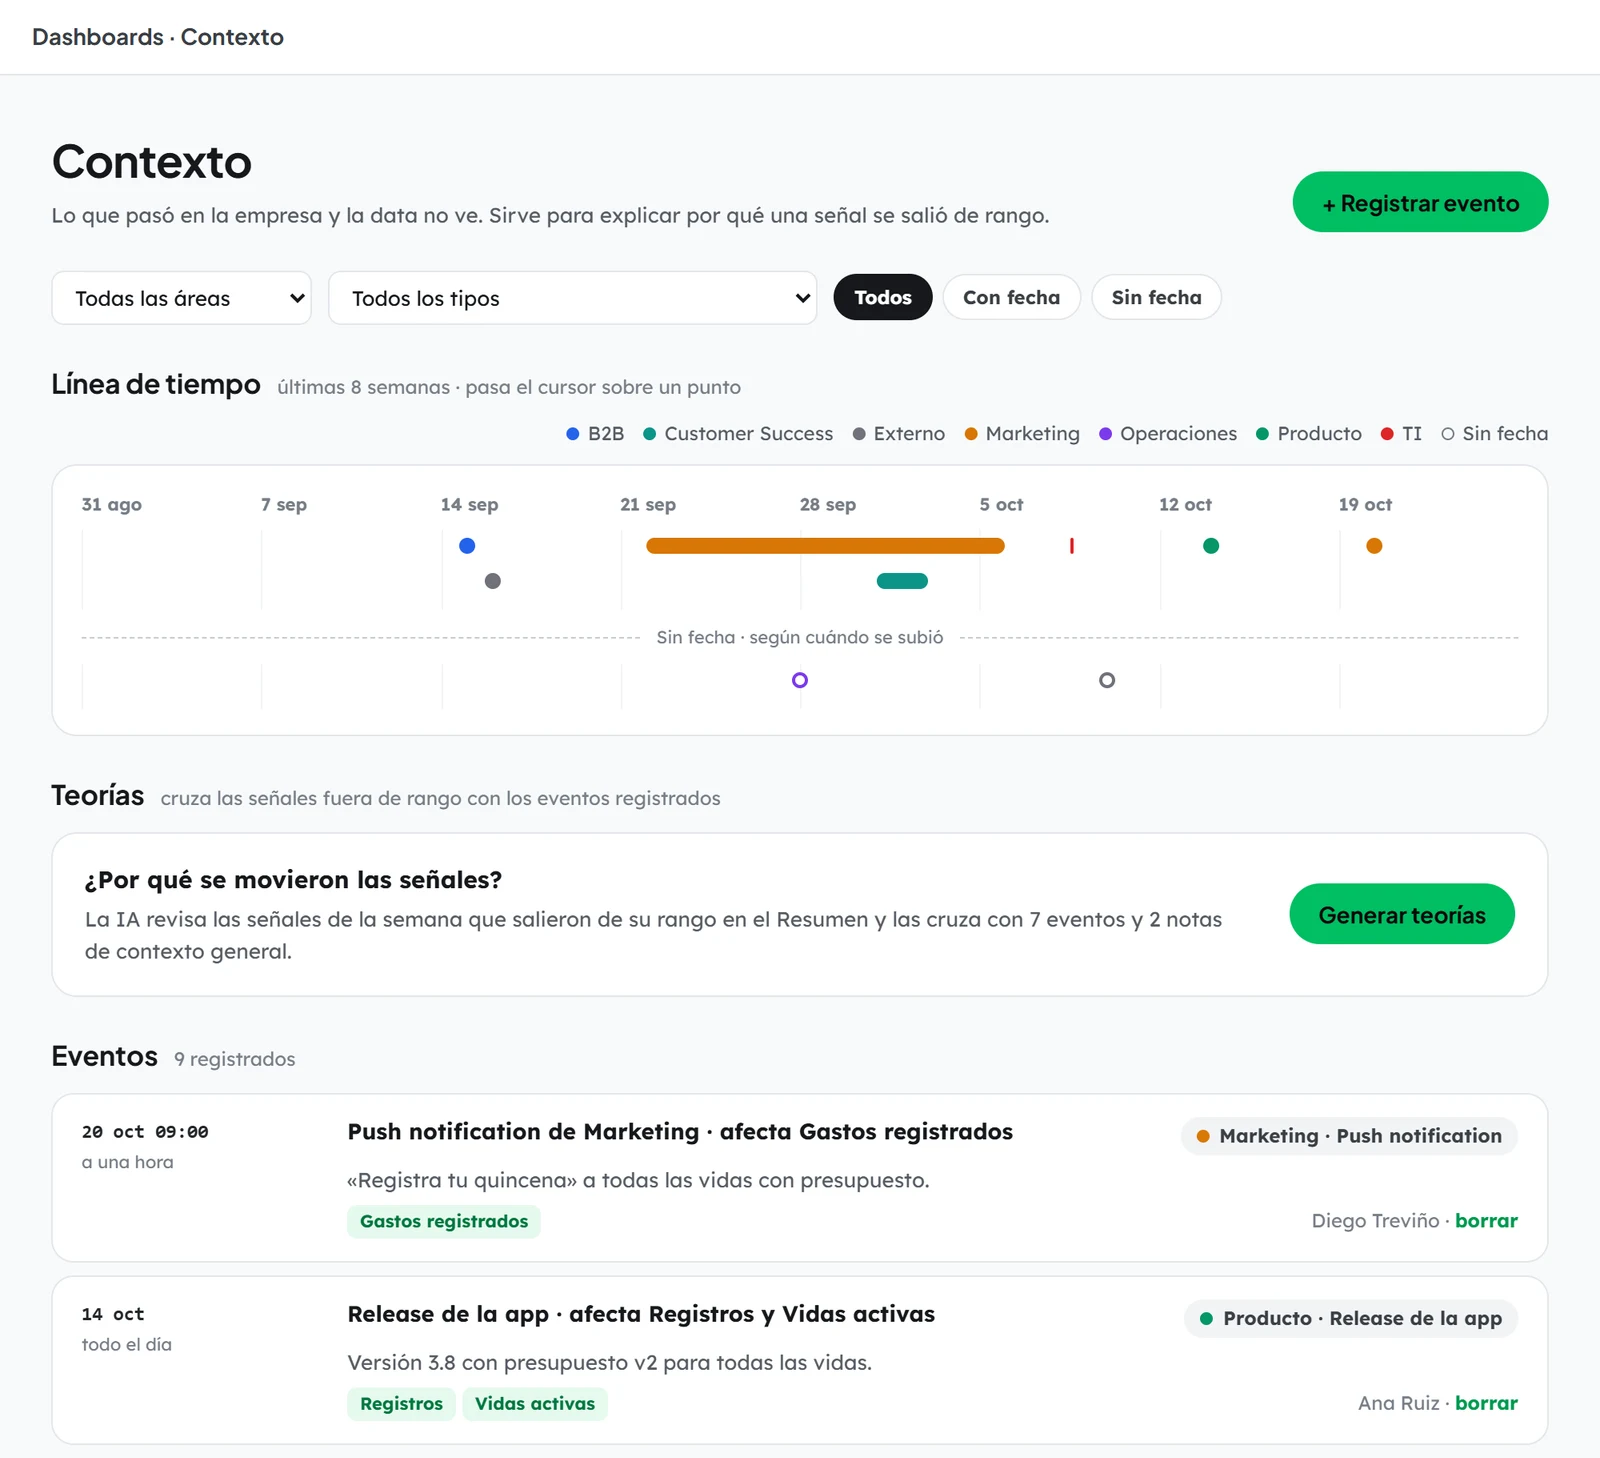
What the data can't see.
Releases, campaigns, incidents, a new client: anything that could explain a movement is logged as an event, with its date and the signals it might affect. AI suggests theories for what moved a metric — treated as hypotheses, never conclusions, each with what to check to confirm it.
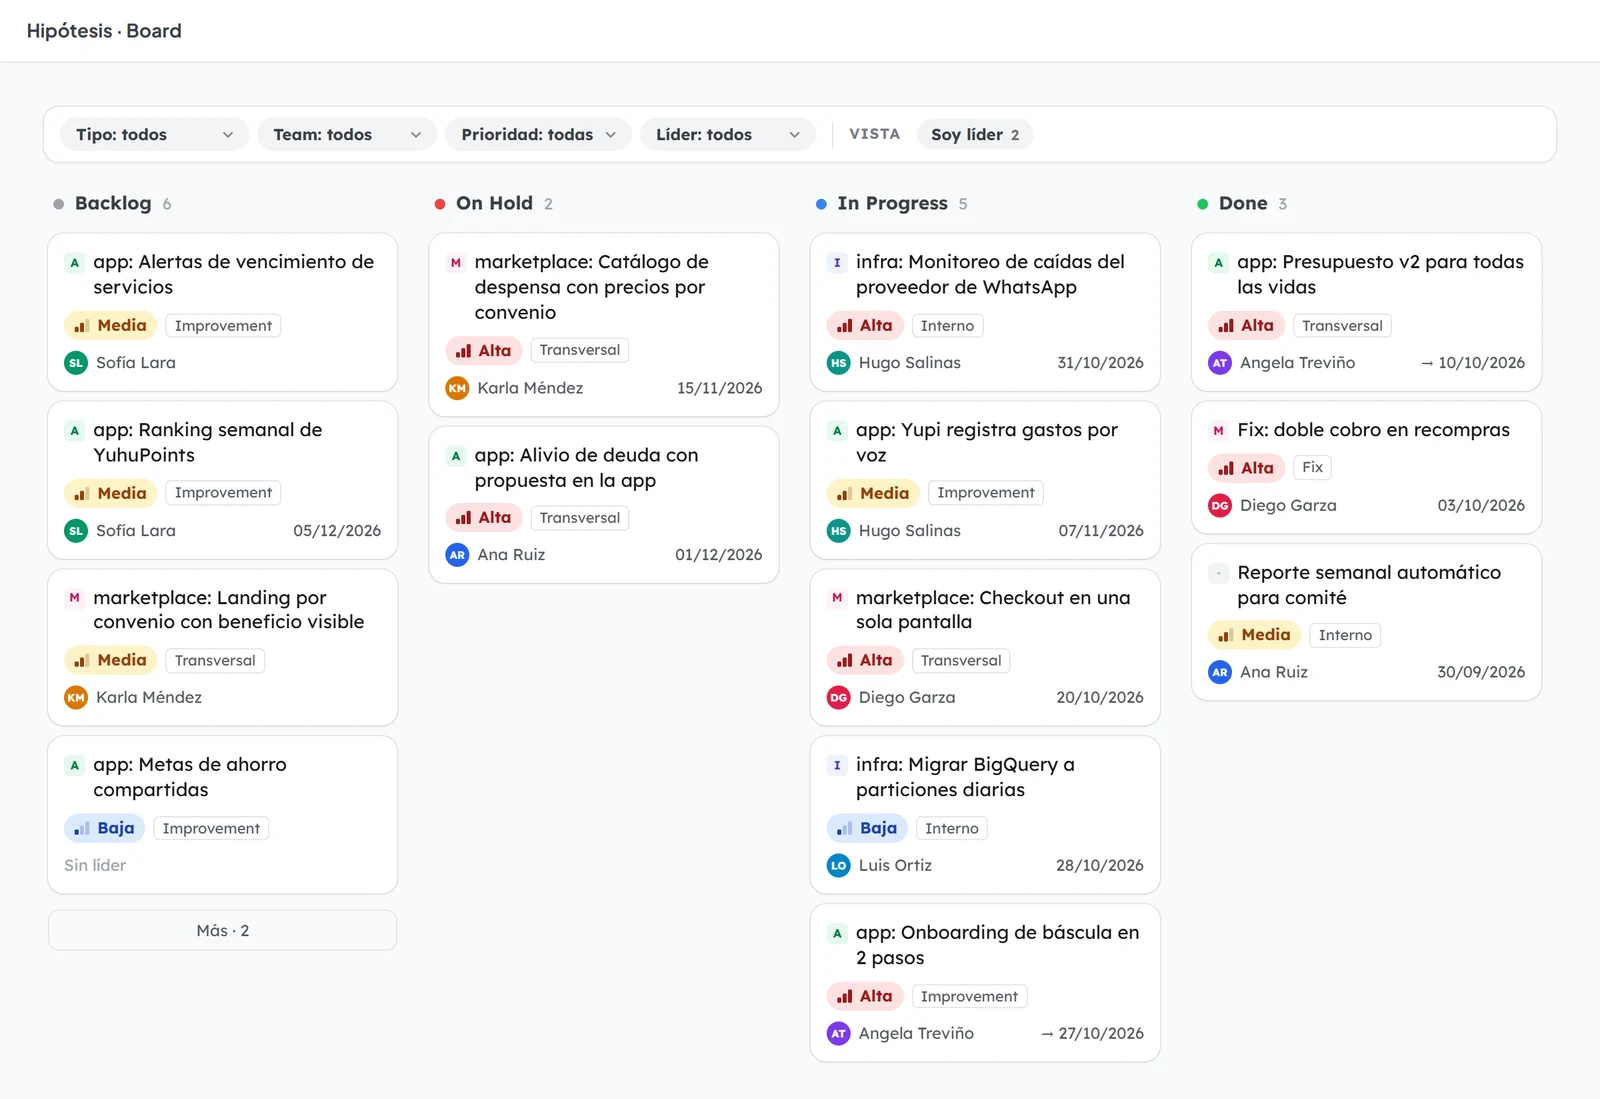
Work with visible results.
Every initiative is a hypothesis: what we believe will happen, who leads it, when it delivers, and how it’s progressing. Reviewing them next to the metrics they should move keeps the roadmap honest.
The weekly ritual.
- Every day
Each leader posts progress on their hypotheses for the daily.
- Reviewing metrics
Open the summary by day, week, or month and check the signals in alert.
- When something moves
Log the event and generate theories with AI.
- Every week
A weekly report with AI-written insights to start the conversation.